The atmosphere protects Earth from most meteors. That’s because meteors are moving so fast (25,000mph to 160,000mph) they began to incandesce and burn up when they enter the upper atmosphere. Most space debris eventually meets a similar fate.
The lowest layer of the atmosphere is the troposphere, which is around 10 to 15 kilometers (6–9 miles) thick. The troposphere is where weather occurs. The next layer, the stratosphere, extends from the top of the troposphere (the tropopause) to 50km (31 mi.). Most of the ozone layer is within the stratosphere. The mesosphere lies above the stratosphere and reaches an elevation of 85km (53 mi.). The thermosphere then takes over and reaches several hundred or more miles. Most meteors burn up in the thermosphere from 80–120km (50–75 mi.) high.


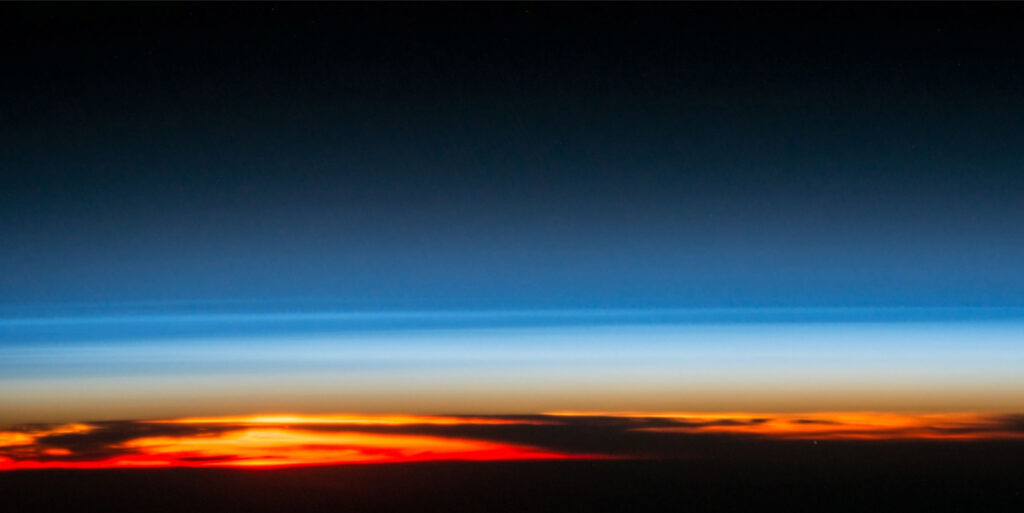
Figure C is a photograph of the atmosphere and Earth’s limb over Patagonia on October 27, 2016. This remarkable image was captured by an astronaut of the International Space Station’s Expedition 49 crew while in orbit 400km (250 mi.) over the South Atlantic Ocean.
Look carefully and you’ll see multiple layers just like those that are detected with a twilight photometer. The red and orange layer is the troposphere, brightly colored by dust from the desert below. The tropopause over Patagonia is around 12km (7.5 mi.) high, which means the fuzzy brown, blue, and white layers above the troposphere indicate the stratosphere, which is usually much more uniform in appearance.


Figure D shows an intensity scan superimposed over a narrow section of the photo in Figure C. This scan was made with ImageJ image analysis software (free from imagej.nih.gov/ij). The estimated scale correction factor on the vertical y axis assumes that the top of the orange-red layer is the tropopause. This means the top of the stratosphere is approximately at the 685 point on the y axis, and this is where the mesosphere begins.
The intensity scan in Figure D clearly shows dust layers in the troposphere and unknown aerosol layers in the stratosphere. Based on my hundreds of twilight photometer scans of the evening sky, even very small undulations suggest the presence of aerosols. Therefore, some of the small bumps in the scan within the mesosphere are probably caused by aerosols too.


Figure E is a twilight photometer profile over my Geronimo Creek Atmospheric Monitoring Station (a field by my office) that shows a thick layer of dust from the Africa’s Sahara Desert. This stuff arrives over my site most summers. My photometers also detect smoke, smog, and even volcanic plumes like the one from Russia’s Raikoke volcano.

