Business Intelligence & Analytics Examples: 3 Industries in Focus
In the business world, initiatives are usually locked unless they promise a decent return on investment. According to this scenario, BI initiatives have a high chance of being implemented. Judge for yourselves: ‘BI initiatives drive an average return on investment of 11% and are seen to generate revenue growth and cost savings from every business function’.[1]
With a ‘bring value’ principle in their DNA, ScienceSoft’s business intelligence implementation team puts best efforts for your BI project to generate an above-the-average ROI. In this article, we’ve compiled business intelligence examples so that you could get a real feel of BI capabilities in 3 industries. For each industry, you’ll find:
- Typical insights that a BI solution helps to get.
- Examples of dashboards implemented on Microsoft Power BI, a self-service analysis and visualization tool.
- Real-life examples of BI solutions that ScienceSoft developed for the retail, healthcare, and real estate development industries.

Business intelligence for retail: Focus on customers and performance
Retail-specific insights
With the help of business intelligence software, retail companies can:
- Understand customer segments, their preferences and behavior across the channels (i.e., store, web, mobile, social media).
- Analyze sales from different angles, i.e., like-for-like sales, sales by geography, by channel, by store, by category.
- Measure the performance of retail stores, product categories, product lines, brands, SKUs, private label products, and identify best practices.
- Create data-driven forecasts (i.e., for sales, for new product lines).
- Analyze the performance of an online store: traffic, conversion rates, cart abandonment, wish list, promotion efficiency.
- Map the number of employees to the customer traffic flow, and the inventory level to sales.
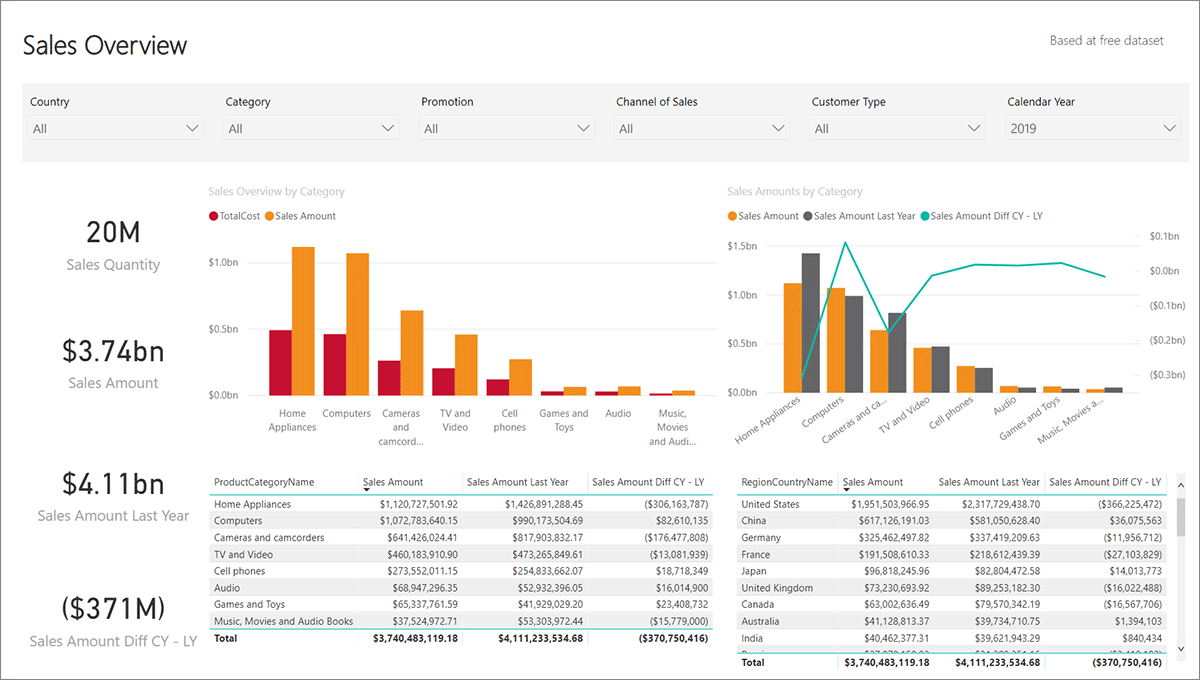
An example of a retail dashboard

Being that concise, the dashboard can show the retailer’s sales from different perspectives as it allows applying multiple filters. For example with a few clicks, a business user can choose a specific country, a product category and a sales channel, and see the graphs and values altered in line with their selection. To see how it works in practice, watch our BI demo.
A real-life business case for retail
For one of our clients, ScienceSoft developed a data analytics solution that enabled robust retail analytics. Aggregating data from CRM, Magento (ecommerce), and Google Analytics, the solution provided an undistorted picture of traffic and conversion rates, as well as allowed measuring the engagement of online store visitors.
Thanks to real-time analytics capabilities embedded in the solution, the customer was able to track the actual stock level both at the warehouse and in the stores, which was a huge step forward compared to the shared document previously used for that purpose.
Besides, the solution allowed for goal management and KPI tracking, which helped the customer to assess their employees’ quality of work (i.e., how much they cross-sell and up-sell).
Read also:
Business intelligence for healthcare: Focus on patients, control of financials and improvement
Healthcare-specific insights
With BI solutions, healthcare providers can aggregate electronic health records, patient-generated health data, and internal data on costs, staffing, and utilization (i.e., of beds, equipment, operating rooms) to:
- Monitor patients’ health status, evaluate the treatment progress and reduce the rate of readmissions.
- Analyze and improve patient outcomes (i.e., identify trends in disease development, find the dependencies between health risk factors and diagnoses, medications and outcomes).
- Measure and control the financials, such as revenue cycle management, costs, return on investments and cash flow.
- Improve internal processes based on analyzing medication use, equipment and bed utilization efficiency.
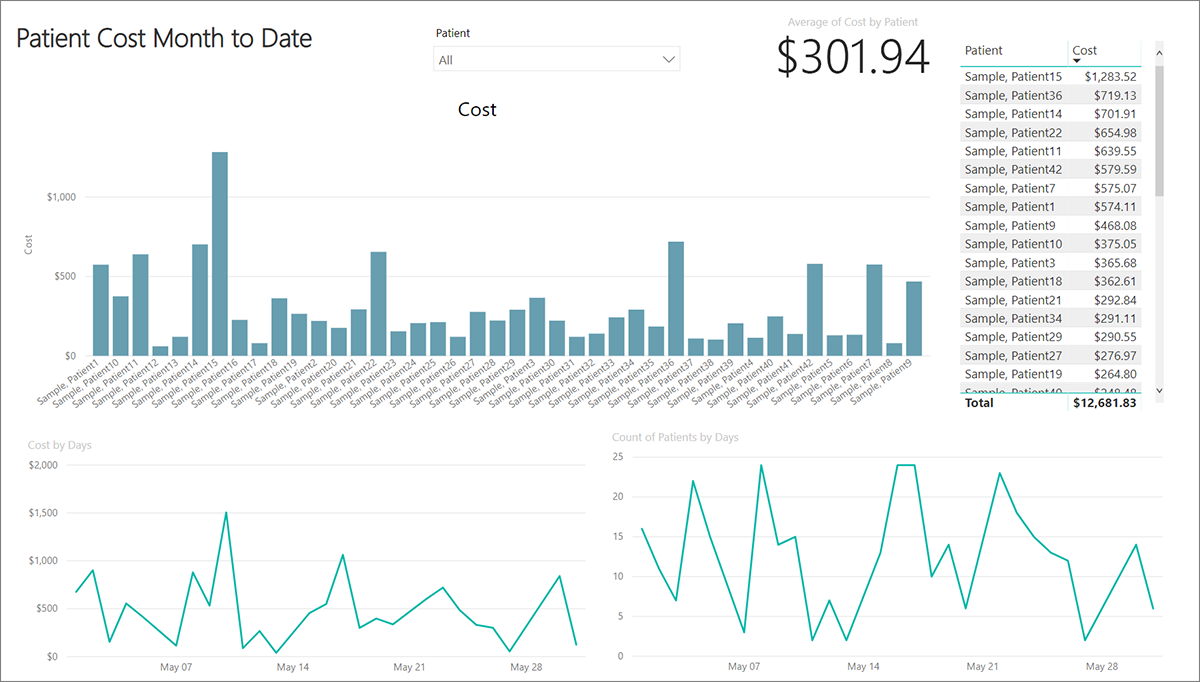
An example of a healthcare dashboard

A real-life business case for healthcare
ScienceSoft implemented a BI solution for a health information exchange vendor. The solution aggregated data retrieved from the systems of multiple healthcare providers and allowed its comprehensive analysis. Our BI team also designed and implemented a set of dashboards to let the customer:
- Check the patients’ profiles.
- Analyze health problems the patients encountered, classify these problems (i.e., by type, time range, patients’ age), and identify the most frequent ones.
- Track the medications used.
- Find out dependencies, i.e., those existing between diagnoses, medications and health problems.
Business intelligence for real estate development: Focus on property and tenant management
Real estate-specific insights
With BI applications in place, real estate developers can:
- Efficiently manage the property by analyzing property metrics, use, tenure, occupancy status.
- Assess the location and availability of the property.
- Improve space utilization by understanding occupancy (i.e., by geography, property type) and payable rent.
- Monitor the financial health of the business (by tracking such KPIs as a net income, cash flow, profitability per square foot, market share growth).
- Understand the tenants’ profiles and manage them.
- Manage risks.
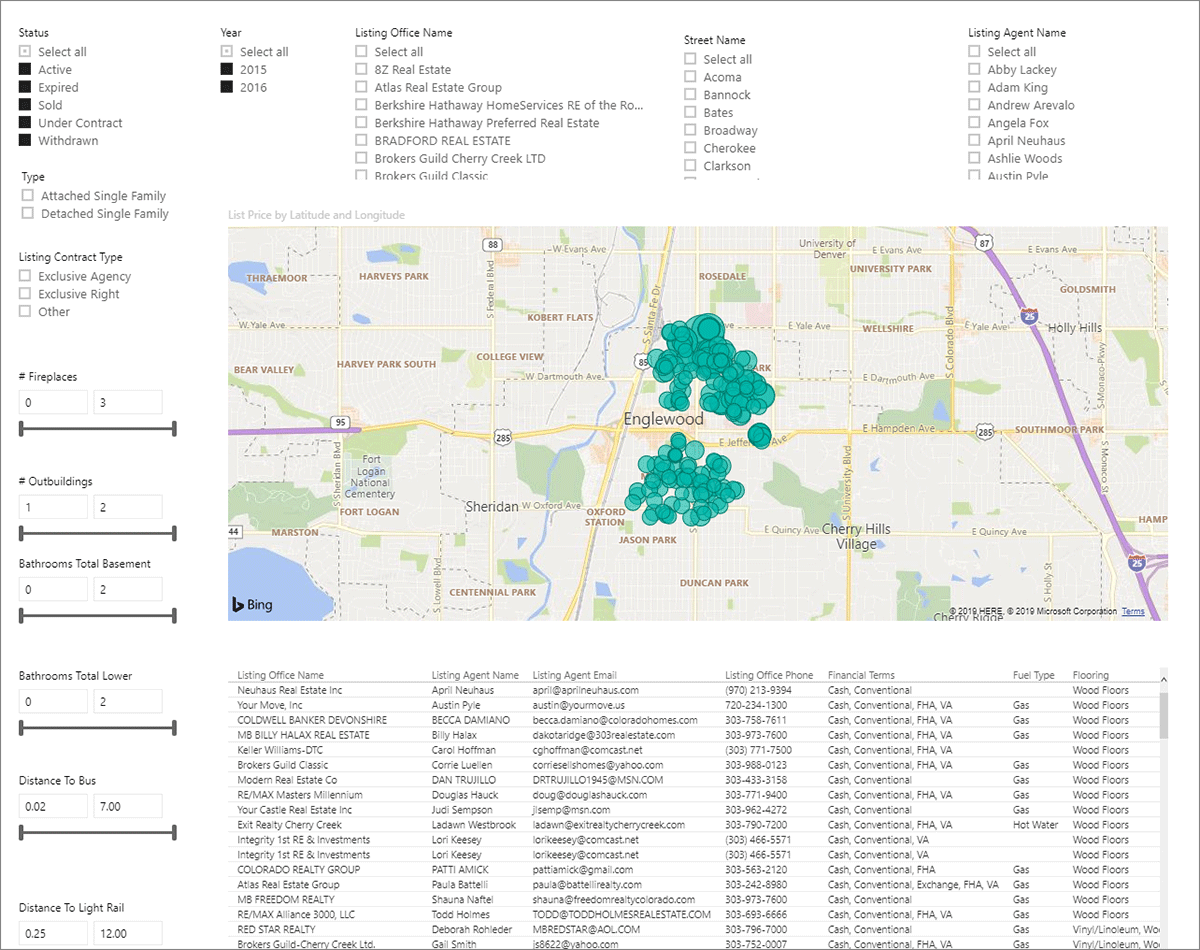
An example of a dashboard for a real estate developer

A real-life business case for real estate development
For a commercial and residential real estate developer, ScienceSoft implemented a BI solution that enabled comprehensive financial reporting based on the data aggregated from 40 diverse data sources. The reporting embraced main financial indicators like income, operating expenses, cash at the end of the period, assets and liabilities, and more, for both the entire company and its separate branches. 17 financial reports of different levels of detail provided the developer with a multifaceted view of their finances.
Though different, these BI examples have something in common
Despite a BI solution is always tailored to a certain business and its needs, we can still name two features shared by the three examples we considered:
- Data aggregation is power: making use of data retrieved from multiple sources is a foundation for comprehensive and insightful reporting.
- It’s convenient when a reporting tool allows for self-service business analytics with drill-down and filtering opportunities, as well as intuitive dashboards – this speeds up the path to insights.
[1] Source: Dresner Advisory Services LLC, accessed on 10/22/2019.