Not once in their practice, our data scientists have heard such complaints from retailers and manufacturers as suppliers missing delivery deadlines, failing to meet quality requirements or bringing incomplete orders. To avoid these problems, businesses strive to optimize their current approaches to assessing supplier risks. As the issue is common and its criticality is in the air, our data science consultants decided to share best practices and describe an alternative approach to assessing supplier risks. This one relies on deep learning – the most advanced data science technique – and allows businesses to build accurate short-term and long-term predictions of a supplier’s failure to meet their expectations.
Here’s the summary of everything that we cover in our blog post:
The limitations of the traditional approach to supplier risk assessment
Traditionally, businesses assess supplier risks based on such general data about suppliers as their location, size and financial stability, leaving out suppliers’ daily performance. And even if suppliers’ performance is considered, the traditional approach usually means a simplified classification that can easily result in a table like this:
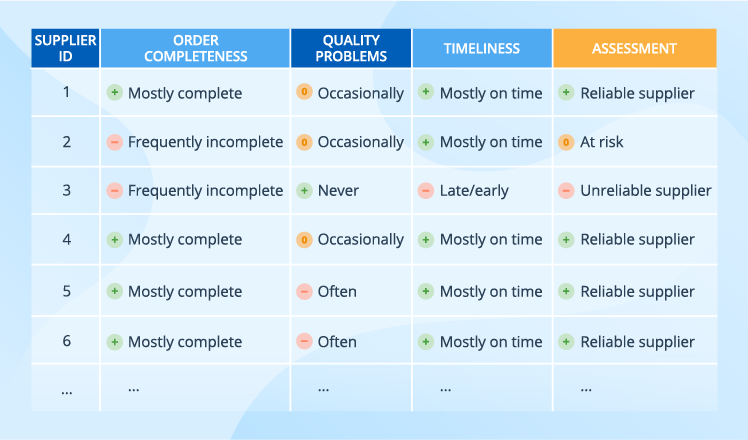
With such an approach, several suppliers are rated the same. But the table doesn’t show a particular pattern, say, a trend in the latest deliveries of a particular category by the given supplier.
The data science-based approach to supplier risk assessment
Our data scientists suggest an alternative to the traditional supplier risk assessment – a data science-based approach. However, to enjoy it, a business must have extensive data sets with supplier profiles and delivery details, which serve as a starter kit. Without this data, a business cannot proceed with designing and developing a solution.
Below, we suggest a possible structure for each of the data sets, but they are neither obligatory nor rigid and only serve as an example. To make the set relevant for their needs, businesses can add specific properties, for example, expand a supplier profile with such criteria as financial situation, market reputation, and production capability.
Supplier data

A supplier can mean either a company with all its manufacturing facilities or a separate manufacturing facility.
Delivery data
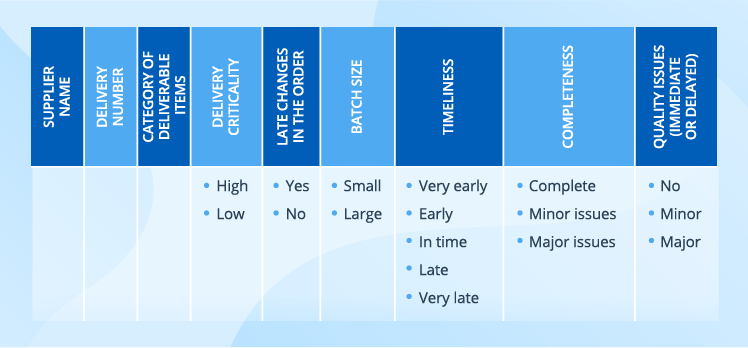
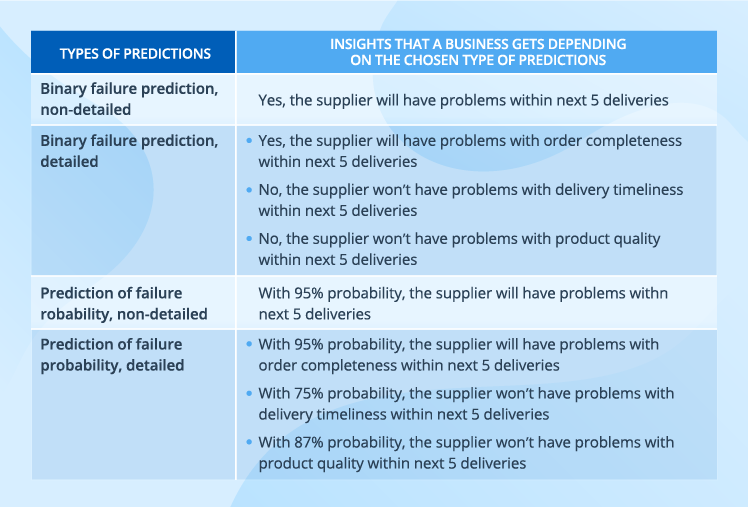
Data science allows analyzing this diverse data and converting it into one of the prediction types like in the table below.
The essence of a data science-based solution
Based on our experience, we suggest using a convolutional neural network (CNN) for the solution. Let’s go through its constituent parts.
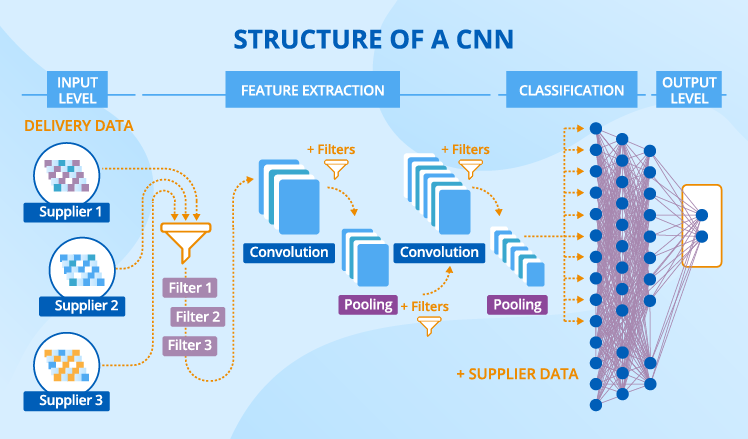
A CNN has a complex structure consisting of several layers. Their number can vary depending on what criteria a business identifies as meaningful in their specific case, as well as on the output that they expect to receive. We’ll take the data from our example to illustrate how the CNN works. And the expected output is a binary non-detailed prediction of whether a supplier will fail within 3 and within 20 next deliveries.
Ingesting data
Let’s put supplier data aside for a while – we’ll need it a bit later – and focus on delivery data. For a CNN to consume it, delivery data should be represented as channels, where each channel corresponds to a certain delivery property, for example, delivery criticality.
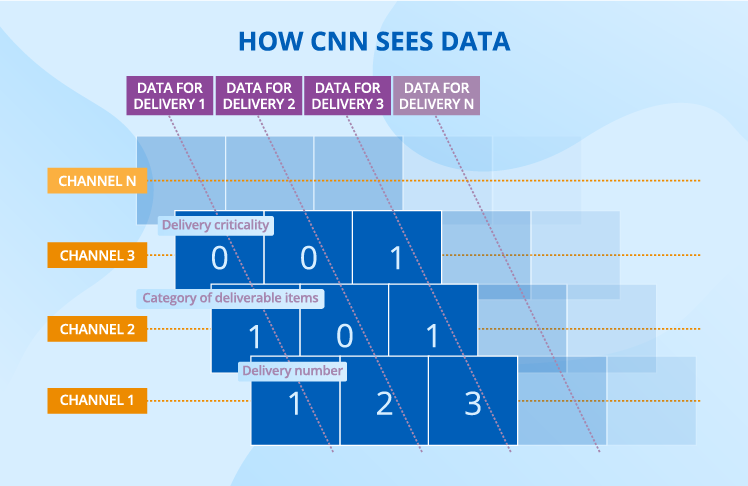
In every channel, each cell (or a ‘neuron’ if we use data science terms) takes a certain value in accordance with the encoding principle chosen. For example, we may choose the following gradation to describe the timeliness property: -1 for ‘very early’, -0.5 for ‘early’, 0 for ‘in time’, 0.5 for ‘late’ and 1 for ‘very late’.
Extracting features
In deep learning, a feature is a repetitive pattern in data that serves as a foundation for predictions. For delivery data, a feature can be a certain combination of values for delivery criticality, batch size and timeliness.
As compared with other machine learning algorithms, a CNN has a strong advantage – it identifies features on its own. Though feature extraction skills are inherent to CNNs, they would come to nothing without special training. When a CNN learns, it examines a plethora of labeled data (the historical data that contains both the details about suppliers and deliveries and the info whether a supplier has failed) and extracts distinctive patterns that influence the output.
When features are known, a CNN performs a number of convolution and pooling operations on the newly incoming data. During convolution, a CNN tries each feature (which serves as a filter) to every possible fragment of the delivery data. Very simple math happens at this stage: each value of the fragment gets multiplied by the corresponding value of the filter, and the sum of these results is divided by their number. After this operation, each initial fragment with delivery data turns into a set of new (filtered) fragments, which are smaller than the initial one, still they preserve all its features. During convolutions, the CNN extracts first low-level features then high-level features, increasing the scale at each new layer. For example, low-level features cover 3 deliveries, while high-level features may cover 100 deliveries.
During pooling, a CNN takes another filter (called ‘a window’). Contrary to feature filters, this one is designed by data scientists. A CNN slides the window filter over a convoluted fragment and chooses the highest value each time. As a result, the number of fragments does not change, but their size decreases dramatically.
Classifying into failure/non-failure
After the last pooling operation, the neurons get flattened to form the first layer of a fully connected neural network where each neuron of one layer is connected with each neuron of the following layer. This is another part of a CNN, which is in charge of making predictions.
It’s time to recall our supplier data, as we add it to the neurons with the results received during feature extraction, to improve the quality of predictions.
At the classification stage, we don’t have filters anymore. Instead, we have weights. To understand the nature of weights, it would be useful to regard them as coefficients that are applied to each neuron’s value to influence the output.
These multiple data transformations end with the output layer, where we have two neurons that say whether the supplier will fail within 5 and within 20 next deliveries. Two neurons are required for our binary non-detailed prediction, while other prediction types may require a different structure of the output layer.
A few extra words about how a CNN learns
When a CNN starts learning, all its filters and weights are random values. Then the labeled data flows through the CNN and all the filters and weights are applied. Finally, the CNN produces a certain output, for example, this supplier will fail both short-term and long-term. Then it compares the predictions with what really happened to calculate the error it made. Say, in reality, the supplier delivered on their commitments, both short- and long-term. After that, the CNN adjusts all the filters and weights to reduce the error and recalculates the prediction with newly set weights. This process is repeated many times until the CNN finds the filters and weights that produce the minimum error.
Why the data science-based approach is good and not so good
Based on the example of the described solution, we can draw a conclusion about some benefits and drawbacks of the data science-based approach.
Advantages
An unbiased view of a supplier
A CNN leaves no room for subjective opinions – it sets its filters and weights and no buyer can influence the transformations that happen. Contrary to the traditional approach, a solution based on data science allows for unified assessment of supplier risks as it relies on data, not on personal opinions of category or buyers.
Captured everyday performance
Instead of deciding on a supplier’s reliability once and for all, data-driven businesses get regular updates about each of their supplier’s performance. If, say, the supplier is late or the order is incomplete or something else is wrong with the delivery, an entry appears in the ERP system and this information is soon fed into a CNN to influence the predictions.
A detailed view of a supplier’s performance
Generalized assessment that a traditional approach offers is insufficient for risk management. We assume that a supplier has occasional problems with product quality. But does this mean that a business will face this problem during the supplier’s next delivery? A data science-based approach has a probabilistic answer to this and other questions as it considers numerous delivery properties and supplier details.
Identified non-linear dependencies
Linear dependencies are rare for business environment. For instance, if the number of critical deliveries for a certain supplier increased by 10% and this led to a 15% rise in short-term failures, this wouldn’t mean that the increase of critical deliveries by 10% for another supplier will also lead to 15% more short-term failures. A CNN, like any deep learning algorithm, is built around capturing both linear and non-linear dependencies – the neurons of the classification part have non-linear functions at their core.
Limitations
Though a data science-based approach to measuring supplier risks offers many advantages, it also has some serious limitations.
Dependence on data amount and quality
In order to get trained and build predictions that can be trusted, a data science-based solution needs big amount of data. Therefore, the solution is not suitable for companies that have a scarce supplier base and/or a very diverse supplier set that doesn’t contain any stable pattern. Frequency of deliveries is an important limitation, too – the approach won’t work for suppliers who deliver rarely.
Need for professional data scientists
The accuracy of predictions is in data scientists’ hands. They make a lot of fundamental decisions, for instance, on the solution’s architecture, the number of convolution layers and neurons, and the size of window filters.
Serious efforts required for adoption
It’s insufficient just to design and implement a solution based on data science. A business should always think about measures to take to introduce the change smoothly. Without dedicated training on deep learning basics in general and on the solution in particular, category managers or buyers won’t trust the predictions and will continue with their traditional practices of working with Excel tables.
To keep with the tradition or to advance with data science?
Neither traditional nor data science-based approaches to supplier risk assessment are flawless, but their limitations are of different nature. While the traditional approach is relatively simple in terms of implementation but quite modest in terms of business insights, the data science-based approach is its exact opposite. On the one hand, it’s extremely dependent on the amount and quality of data, it requires the involvement of professional data scientists and serious efforts for adoption. But on the other hand, it can produce different types of accurate predictions that consider each supplier’s daily performance. And this can be an effective prevention of many diseases triggered by unreliable suppliers.

