The learning curve is another key concept that is applied to measure the aspects of experience and efficiency gains in time. The learning curve is a concept that applies to the manufacturing process, training, and any operation that involves a skill in realizing that the time or cost of the unit or task reducing with an increase in the number of units or tasks accomplished. First, the rate of increase within the first units is steep, but the rate drops to a steady slope, and then to a horizontal line. Analysis of the learning curve offers businesspersons important insights into the optimization of production systems, cost control, and training strategies.

Learning Objectives
- Understand the concept and significance of the learning curve in various industries.
- Learn how to calculate and apply the learning curve formula to real-world scenarios.
- Analyze the impact of the learning curve on production efficiency and cost reduction.
- Explore different factors influencing the shape and steepness of a learning curve.
- Develop skills to visualize and interpret learning curves using data analysis tools.
What is Learning Curve?
The learning curve represents the phenomenon where the time or cost of completing a task decreases as experience increases. In simpler terms, as people or organizations perform a task repeatedly, they become more efficient at it, and this is reflected in reduced time or cost per unit of output.
A typical learning curve is normally characterized by an initial stage where changes are steep because of the increasing understanding of how a certain task is to be done. Extending the curve to the right we get a curve that is flattened as further improvement become marginal indicating that the task has become routine and there is little to be gained.
Key concepts related to the learning curve include:
- Initial Learning Phase: The stage where individuals or organizations are most inefficient, and the curve is steep.
- Plateau or Diminishing Returns: After initial rapid learning, further progress slows down, causing the curve to flatten.
- Cumulative Experience: The total number of units produced or the total amount of time spent on the task, directly influencing the improvement rate.
Types of Learning Curves
There are several variations of the learning curve that reflect different rates of improvement. These curves can be classified into three main types:
- Steep Learning Curve: The initial phase of the curve is steep, indicating rapid learning and significant improvement in performance or efficiency. This type of curve occurs when tasks are initially unfamiliar, and people are highly motivated to learn.
- Example: A beginner learning a new software tool or a company setting up a new manufacturing process might experience a steep learning curve as they quickly become proficient.
- Shallow Learning Curve: The learning curve is flatter, indicating slower improvements. This occurs when the task is relatively simple or when the learner has prior knowledge or skills related to the task.
- Example: An experienced worker learning a small variation in an existing process might experience only modest gains as the new task requires minimal adjustment.
- Flat Learning Curve: In some cases, after a period of rapid improvement, the curve flattens out, indicating that further learning becomes incremental, with little or no improvement in performance. This often occurs when maximum proficiency has been reached.
- Example: A high-level expert in a field might face a flat learning curve, as the task becomes so routine that further progress is extremely difficult.
Importance of Understanding the Learning Curve
Understanding the learning curve is crucial for several reasons, as it helps organizations, businesses, and individuals optimize resources, plan effectively, and improve efficiency. Here are some key points highlighting its importance:
- Cost Reduction: By recognizing how time or costs decrease as experience increases, businesses can predict cost savings over time. The learning curve allows companies to estimate the reduction in production costs as workers gain more expertise and processes become streamlined.
- Efficiency Optimization: Understanding the learning curve helps identify areas where processes can be optimized, enabling businesses to improve productivity and achieve higher output with less effort and time.
- Forecasting and Planning: The learning curve provides a reliable tool for forecasting future performance. It helps organizations plan for long-term growth, determine when efficiency will plateau, and manage resource allocation effectively.
- Improving Training Programs: In skill development and employee training, understanding the learning curve helps organizations design more effective training programs. It allows businesses to anticipate how quickly employees will gain proficiency and helps in setting realistic performance goals.
- Strategic Decision-Making: By understanding how learning and efficiency improve over time, businesses can make better strategic decisions about scaling production, introducing new products, or investing in technologies that enhance learning rates.
- Competitive Advantage: Companies that understand and apply the learning curve can gain a competitive edge by reducing costs and increasing production speed faster than their competitors. This understanding can also help companies stay ahead in terms of innovation and technological adoption.
Working of Learning Curve
The learning curve works on the principle that as an individual, team, or system repeats a task or process, they become more efficient over time. Initially, the time or cost required to produce the first unit is high due to unfamiliarity with the task. However, as more units are produced or tasks are performed, efficiency increases, resulting in a decrease in the time or cost per unit. This phenomenon occurs due to reduced errors, improved techniques, faster decision-making, and better utilization of resources.
The learning curve typically follows a predictable pattern where the rate of improvement is rapid at first but slows down over time as the task becomes more familiar. Over time, the curve levels off, indicating that further improvements will be marginal as the task becomes routine.
Key Variables in the Learning Curve
- Initial Time (a): This is the time or cost required to produce the first unit or complete the first task. It represents the starting point on the learning curve and is typically the highest value because of inefficiencies and inexperience.
- Learning Curve Index (b): The learning curve index (b) represents the rate at which efficiency improves as more units are produced or tasks are completed. A negative value of b indicates a decrease in time or cost, and its magnitude determines how quickly efficiency increases. A steeper curve (more negative b) suggests faster learning and greater improvements early on. A shallower curve (less negative b) indicates slower learning and improvements.
- Number of Units or Tasks (X): This refers to the number of units produced or tasks completed over time. As the number (X) increases, the time or cost per unit decreases, illustrating the impact of repeated practice or production. The relationship between time and the number of units follows a decreasing exponential function.
- Time or Cost per Unit (Y): This is the dependent variable on the learning curve, representing the time or cost needed to produce each unit or complete each task. As experience increases, the time or cost required per unit decreases.
Learning Curve Formula
The mathematical relationship that describes how time or cost decreases with increased experience is often represented by the formula:

Where:
- Y = Time or cost to produce the Xth unit
- a = Time or cost to produce the first unit (initial time)
- X = Cumulative number of units or tasks produced
- b = Learning curve index, which dictates the rate of improvement
This formula helps in calculating the expected time or cost for any unit number (X) based on the initial time and the learning curve index. By plotting the curve, businesses can visually track how their efficiency improves over time.
Learning Curve Calculation Example:
Imagine a company is producing widgets, and the time to produce the first unit is 100 hours. Based on historical data, the company has determined that the learning curve index b is -0.3, meaning that with each doubling of production, the time required to produce each unit decreases by 30%.
We can calculate the time to produce the 5th unit as follows:
- a = 100 hours (time for the first unit)
- b = -0.3
- X = 5 (we want to know the time for the 5th unit)
The formula is:

Calculating the exponent:

So, the time to produce the 5th unit is approximately 72.48 hours.
Interpreting the Formula:
- When X = 1 (the first unit):
The formula simplifies to Y = a, meaning the time or cost for the first unit is the initial value (a). - As X increases:
The exponent b ensures that the time or cost decreases. The larger the number of units produced, the closer the time or cost gets to its minimum value.
Learning Curve and Doubling of Production
A commonly used rule in the learning curve theory is the doubling rule, which states that every time the number of units produced doubles, the time or cost required to produce each unit decreases by a fixed percentage. This relationship is reflected in the learning curve equation, where the exponent b governs how quickly this reduction happens. For example, a 20% learning curve means that every time production doubles, the time per unit decreases by 20%.
Logarithmic Form of the Learning Curve
In practice, the learning curve equation is often transformed into a logarithmic form to simplify analysis, especially when dealing with large datasets.
The logarithmic form is:

By taking the logarithm of both sides, we can linearize the curve, which makes it easier to estimate the parameters a and b from real-world data through regression analysis.
This transformation is particularly useful when analyzing large-scale production data, as it converts the exponential decay into a straight line, making it easier to interpret and forecast.
Implementation and Example of the Learning Curve
The learning curve can be implemented using the mathematical model we discussed earlier. Below, I will walk through an example of how to calculate and visualize the learning curve in a practical scenario, such as manufacturing a product. We will use Python to implement this model.
Step-by-Step Implementation
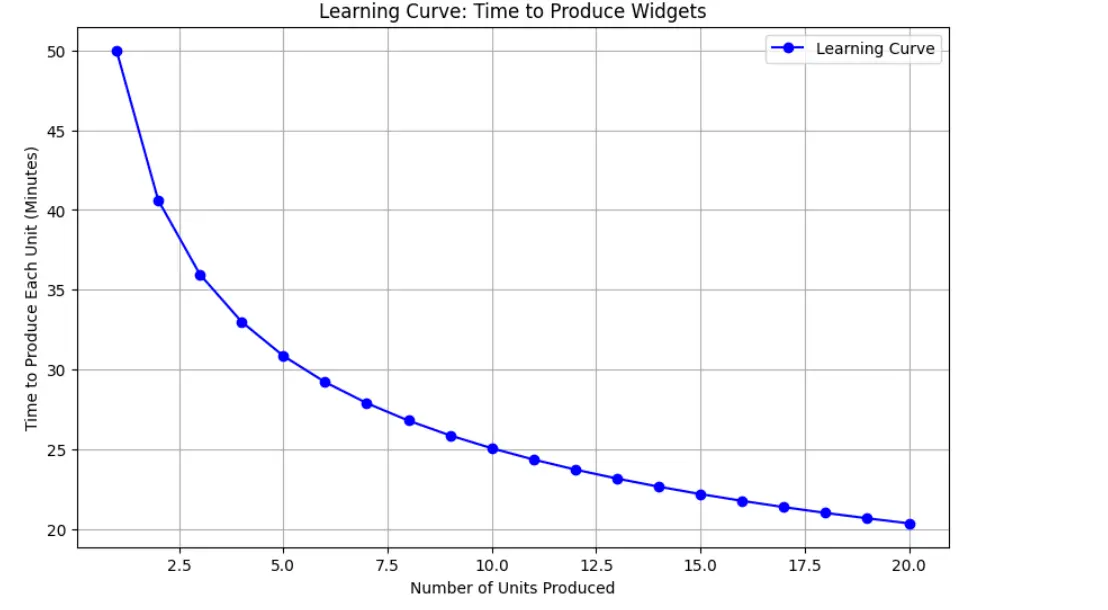
Scenario: Suppose a company is manufacturing widgets, and the time to produce each widget decreases as more widgets are produced. The time to make the first widget is 50 minutes, and the learning curve index (b) is -0.3. We want to calculate and plot the time it takes to produce each widget over a series of 20 widgets.
Step1: Importing Necessary Libraries
We will need libraries like numpy for numerical computations and matplotlib for plotting the graph.
import numpy as np
import matplotlib.pyplot as plt
Step2: Define the Learning Curve Formula
As mentioned earlier, the learning curve is represented by the formula:

Where:
- Y is the time taken for the Xth unit.
- a is the time to produce the first unit (50 minutes).
- X is the number of units produced.
- b is the learning curve index (-0.3).
def learning_curve(a, b, X):
    return a * X**b
Step3: Calculate Time for Multiple Units
Let’s calculate the time taken for each unit from 1 to 20.
# Parameters
a = 50  # Time for the first unit (in minutes)
b = -0.3  # Learning curve index

# Generate the number of units produced (X)
units = np.arange(1, 21)  # 1 to 20 units

# Calculate the time to produce each unit
times = learning_curve(a, b, units)

# Print the times for each unit
for unit, time in zip(units, times):
    print(f"Time to produce unit {unit}: {time:.2f} minutes")
Step4: Plotting the Learning Curve
Now that we have the data, we can visualize the learning curve by plotting the time taken to produce each unit.
# Plotting the learning curve
plt.figure(figsize=(10, 6))
plt.plot(units, times, marker="o", color="b", linestyle="-", label="Learning Curve")
plt.title('Learning Curve: Time to Produce Widgets')
plt.xlabel('Number of Units Produced')
plt.ylabel('Time to Produce Each Unit (Minutes)')
plt.grid(True)
plt.legend()
plt.show()
Output:
Time to produce unit 1: 50.00 minutes
Time to produce unit 2: 40.61 minutes
Time to produce unit 3: 35.96 minutes
Time to produce unit 4: 32.99 minutes
Time to produce unit 5: 30.85 minutes
Time to produce unit 6: 29.21 minutes
Time to produce unit 7: 27.89 minutes
Time to produce unit 8: 26.79 minutes
Time to produce unit 9: 25.86 minutes
Time to produce unit 10: 25.06 minutes
Time to produce unit 11: 24.35 minutes
Time to produce unit 12: 23.73 minutes
Time to produce unit 13: 23.16 minutes
Time to produce unit 14: 22.65 minutes
Time to produce unit 15: 22.19 minutes
Time to produce unit 16: 21.76 minutes
Time to produce unit 17: 21.37 minutes
Time to produce unit 18: 21.01 minutes
Time to produce unit 19: 20.67 minutes
Time to produce unit 20: 20.35 minutes
Importance of Learning Curve
Let us learn about importance of learning curve below:
- Complexity of the Task: More complex tasks take longer to master, slowing down the learning curve. Simpler, repetitive tasks tend to show quicker improvements.
- Worker Skill and Experience: Skilled workers learn faster due to prior knowledge and expertise. Effective training also accelerates learning by providing structured guidance.
- Technological Advances: New tools and automation can reduce task time and enhance learning efficiency. Advanced technologies speed up processes and lower error rates.
- Volume of Production: Repetition boosts efficiency, with each additional unit taking less time. Batch production can slow down learning due to irregular exposure.
- Work Environment and Organizational Factors: Collaborative and supportive work environments speed up learning. Strong leadership and good morale also encourage faster skill acquisition.
- Feedback and Learning from Mistakes: Timely feedback helps workers correct mistakes quickly, speeding up learning. A tolerant environment for errors fosters continuous improvement.
Conclusion
The learning curve is a powerful tool for understanding how efficiency improves over time through experience and repetition. It is also a vital tool for businesses to optimize processes, forecast cost reductions, and allocate resources effectively. It applies across industries, from manufacturing to skill development, emphasizing the diminishing returns of improvement as experience grows. By understanding and leveraging the learning curve, organizations can enhance productivity, plan strategically, and address the challenges of scaling operations or refining performance over time.
Key Takeaways
- The learning curve shows how efficiency improves with repeated practice or production.
- Initial progress is rapid, but the rate of improvement slows over time.
- Learning curve analysis helps predict cost savings and production time reductions.
- The curve’s shape is influenced by factors like the complexity of tasks and learning rates.
- Understanding the learning curve aids in strategic planning and optimizing resources.
Frequently Asked Questions
A: The learning curve is a graphical representation showing how efficiency improves as experience or production increases, with time or cost typically decreasing as more units are produced.
A: The curve flattens as improvements become less significant with each additional unit produced, indicating diminishing returns in the learning process.
A: Businesses use the learning curve to estimate production costs, forecast efficiency improvements, and optimize resources for long-term planning.
A: Factors such as task complexity, worker skill level, training, and technology can influence how quickly efficiency improves and how steep the learning curve is.
A: Yes, the learning curve applies to skill development as well, showing how quickly a person improves at a task over time with practice and experience.

